
Introduction
Most traders spend years chasing hot tips, gut feelings, and market rumors. You probably know how exhausting that cycle feels. What if there was a smarter, more systematic way to find an edge in the market? That is exactly where statistical arbitrage trading comes in.
Statistical arbitrage trading is a quantitative strategy that uses mathematical models, historical data, and statistical relationships to identify and exploit pricing inefficiencies between financial instruments. Instead of guessing where the market is going, you let the numbers guide you. It removes emotion from the equation and replaces it with data.
In this article, you will learn how statistical arbitrage trading actually works, what tools and strategies experienced quant traders use, how to get started even if you are not a math genius, and what risks you need to respect. Whether you are a curious beginner or an intermediate trader looking to level up, this guide breaks it all down in plain language.
What Is Statistical Arbitrage Trading and Why Does It Matter?
Statistical arbitrage trading is not a single strategy. It is an entire family of quantitative approaches that seek to profit from temporary price discrepancies between related financial instruments. The core idea is simple: when two or more assets that historically move together suddenly diverge in price, the strategy bets they will converge again.
Think of two oil companies that usually trade in sync. If one drops sharply while the other stays flat, a statistical arbitrage trader might buy the fallen stock and short the flat one. The bet is that the gap will close. This type of trading became popular in the late 1980s, pioneered by quantitative analysts at firms like Morgan Stanley. Today, hedge funds, proprietary trading desks, and even individual algorithmic traders use it every day.
The reason it matters so much is that it is market-neutral by design. You are not betting that the market goes up or down. You are betting on the relationship between two assets, which makes it a far more disciplined and controlled form of speculation.
How Statistical Arbitrage Trading Actually Works
At its core, statistical arbitrage trading relies on three pillars: identifying correlated assets, detecting when their relationship breaks down, and executing trades that profit when the relationship restores itself.
The first step is finding pairs or groups of securities with a statistically significant historical relationship. This is usually done using correlation analysis or a more advanced technique called cointegration. Two assets might be highly correlated without being cointegrated, and that distinction matters. Cointegration means the two assets share a long-term equilibrium, which gives you a much more reliable signal for mean reversion trades.
Once you identify a pair, you calculate a spread, which is the price difference between the two assets. You then model this spread statistically to understand its average value and how far it typically deviates. When the spread moves a certain number of standard deviations away from its mean, that is your signal. You enter the trade, and you exit when the spread returns to normal. The profit comes from that movement back toward the mean.
This process is repeated across hundreds or even thousands of pairs at once. That scale is what makes statistical arbitrage trading so attractive to institutional players. The individual trades might generate small profits, but the sheer volume and diversification add up to consistent returns.
Common Strategies Used in Statistical Arbitrage Trading
There are several well-known approaches within the broader category of statistical arbitrage trading. Each has its own mechanics, strengths, and limitations.
Pairs trading is the most classic and widely known approach. You pick two historically correlated securities, usually in the same sector, and trade the spread between them. When one outperforms the other by an unusual amount, you short the outperformer and go long on the underperformer. It is clean, intuitive, and still widely used today.
Mean reversion strategies go a step further by modeling the spread as a stationary process that always returns to a predictable average. You use statistical tests like the Augmented Dickey-Fuller test to confirm stationarity. If the spread is stationary, you have mathematical evidence that it will revert, and you trade accordingly.
Index arbitrage takes advantage of price discrepancies between an index and its underlying components or futures contracts. If an ETF is trading at a premium to the value of its holdings, you short the ETF and buy the underlying stocks. This kind of opportunity is usually fleeting, which is why it requires fast execution systems.
Multi-factor models extend the idea even further by looking at dozens of quantitative factors simultaneously. A trader might model relationships based on valuation, momentum, earnings quality, and volatility all at once. The strategy uses these signals to build a portfolio that is hedged against broad market movements while capturing the factor premiums.
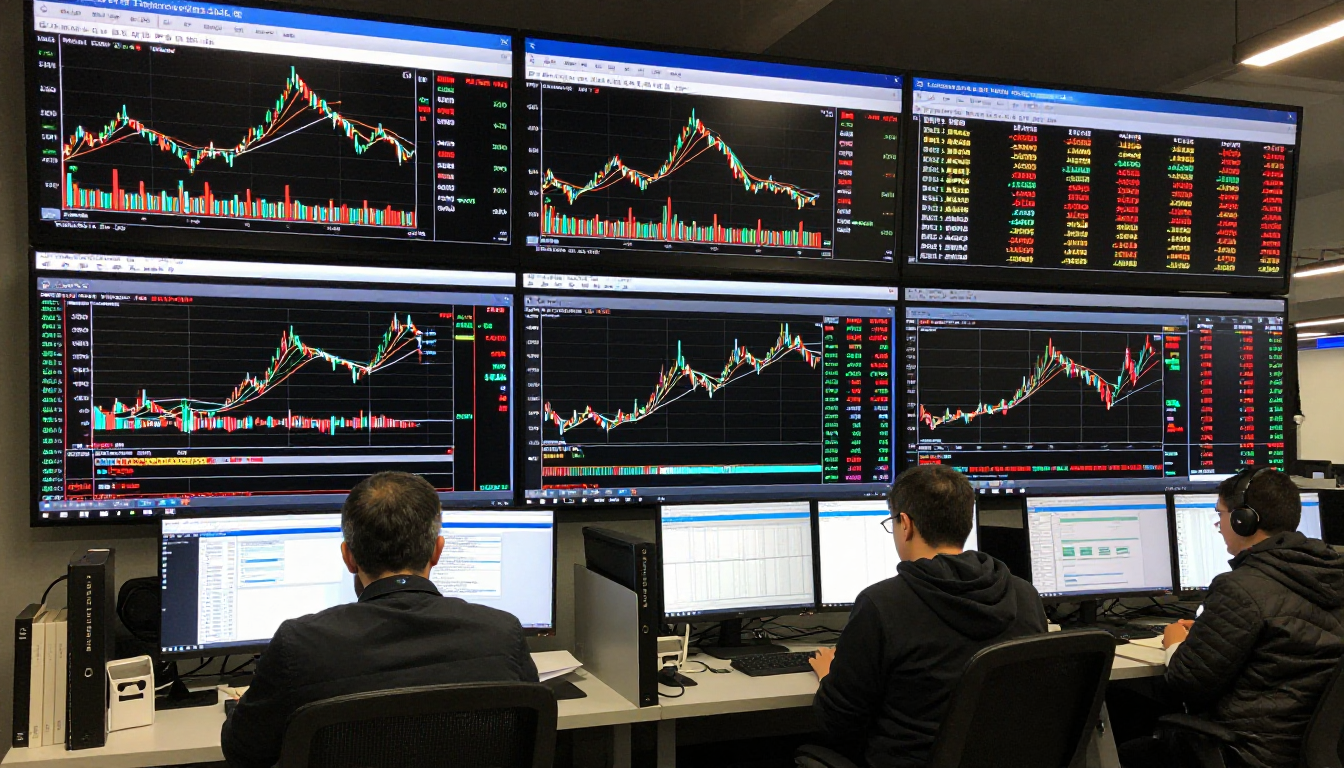
The Technology Behind Statistical Arbitrage Trading
You cannot do statistical arbitrage trading seriously without the right technology. In the early days, quant traders built custom systems from scratch. Today, you have access to powerful tools that make the process far more accessible.
Python is the dominant programming language in this space. Libraries like NumPy, pandas, and statsmodels let you run statistical tests, model spreads, and backtest strategies without writing everything from scratch. If you are not already comfortable with Python, it is worth learning at least the basics. The barrier to entry has dropped dramatically compared to ten years ago.
Backtesting platforms like Zipline, Backtrader, and QuantConnect allow you to test your strategies on historical data before you risk a single dollar. A proper backtest accounts for transaction costs, slippage, and market impact. Skipping those factors is one of the most common mistakes new quant traders make. Your backtest will look great on paper, but the live results will disappoint you.
Execution speed also matters, especially in liquid markets where opportunities disappear in milliseconds. Many professional statistical arbitrage trading operations use co-location services, placing their servers physically close to exchange matching engines to reduce latency. You probably do not need that level of infrastructure when you are starting out, but understanding why speed matters helps you design better systems.
Data quality is another critical factor. Your models are only as good as the data you feed them. Many professional traders invest heavily in clean, survivorship-bias-free historical data. Survivorship bias occurs when you only include assets that are still trading today, which artificially inflates backtested returns.
Risk Management in Statistical Arbitrage Trading
One of the biggest misconceptions about statistical arbitrage trading is that it is low risk. It is not. It carries different risks from traditional directional trading, but those risks are real and can be severe if you ignore them.
Correlation breakdown is the most common danger. Two assets that moved together for years can suddenly stop doing so. A regulatory change, a merger, or a macroeconomic shock can permanently alter the relationship you were depending on. When that happens, your “safe” pairs trade can turn into a significant loss.
The famous collapse of Long-Term Capital Management in 1998 is the most dramatic cautionary tale in quantitative trading history. LTCM used sophisticated statistical models and heavy leverage. When the Russian debt crisis disrupted global correlations, their positions moved violently against them, and the fund lost billions in weeks. Even the smartest models can fail when the world changes faster than your assumptions.
Leverage amplifies everything. Statistical arbitrage strategies often use leverage to boost the returns from small spreads. That same leverage amplifies losses when trades go wrong. You need strict position sizing rules and stop-loss mechanisms to protect your capital.
Liquidity risk is also a factor. If you cannot exit a losing position quickly because the market is thin, your losses can compound. Always factor in the average daily trading volume of the assets you trade. Sticking to liquid markets keeps you in control.

Who Can Use Statistical Arbitrage Trading?
You might be thinking this is only for hedge funds and PhD-level quants. That is no longer true. The democratization of data, computing power, and open-source tools has opened the door for serious retail traders and small funds to participate.
That said, statistical arbitrage trading is not for casual investors. You need a baseline of statistical knowledge, programming skills, and a genuine interest in building systematic processes. If you are comfortable with Excel, learning Python is a natural next step. If you already know Python, you are closer than you think to running your first pairs trading backtest.
Retail platforms like Interactive Brokers provide API access that lets algorithmic traders execute orders programmatically. QuantConnect offers a cloud-based research and backtesting environment with live trading integration. AlphaVantage and Quandl provide historical price data at low or no cost. The ecosystem that supports individual quant traders has never been richer.
I will be honest: your first few strategies will probably not work as well as you hope. That is normal. Every experienced quant trader has a graveyard of failed models. The key is to treat each failure as a data point and refine your process. Persistence and systematic thinking matter more than raw intelligence in this field.
Statistical Arbitrage Trading vs. Traditional Arbitrage
People often confuse statistical arbitrage trading with pure or classical arbitrage, and the distinction is important. Classical arbitrage involves risk-free profits from guaranteed price discrepancies. For example, buying a stock on one exchange where it is priced lower and simultaneously selling it on another exchange where it is priced higher. The profit is locked in with no uncertainty.
Statistical arbitrage is different. The “arbitrage” label is somewhat loose because the profits are not guaranteed. You are making a probabilistic bet that a historical relationship will hold. It usually does, but not always. That probability is your edge, not a certainty.
This distinction changes how you manage risk, size positions, and set expectations. Classical arbitrage opportunities are virtually eliminated by high-frequency trading firms in milliseconds. Statistical arbitrage opportunities last longer because they require more sophisticated modeling to identify, and the edge is probabilistic rather than guaranteed.
Getting Started With Statistical Arbitrage Trading
If you want to begin exploring statistical arbitrage trading, here is a practical roadmap that keeps things manageable.
Start by learning the foundational concepts. Study correlation, cointegration, mean reversion, and the Ornstein-Uhlenbeck process. There are excellent free resources online, and books like “Algorithmic Trading” by Ernest Chan are widely recommended in the quant community. Build a knowledge base before you write a single line of code.
Then choose a simple pairs trading strategy and code it up in Python. Use Yahoo Finance or a free data source to pull daily price data for two stocks in the same sector. Calculate the spread, test for cointegration using statsmodels, and simulate what would have happened if you traded the signals historically. Keep it simple at first.
Once you have a working backtest, stress test it. Change the time period, change the pair, and change the entry and exit thresholds. If your strategy only works under very specific conditions, it is probably overfit to historical data. A robust strategy holds up across a range of conditions, not just the ones you tested.
Paper trade before you go live. Most platforms support simulated trading where you execute trades with fake money in real market conditions. This is invaluable for spotting execution issues, data feed problems, and emotional reactions you did not expect.
Finally, size your positions conservatively when you go live. Even if your backtest shows a Sharpe ratio of two or higher, live markets are messier than historical data. Start small, gather real performance data, and scale up gradually as your confidence in the strategy grows.
Conclusion
Statistical arbitrage trading is one of the most intellectually rewarding and systematically sound approaches to financial markets available today. It rewards curiosity, discipline, and a willingness to let data drive your decisions instead of emotions or headlines.
You now understand the core mechanics behind the strategy, the common approaches quant traders use, the technology that powers these systems, and the risks you need to respect. The playing field has never been more accessible for serious traders who want to build systematic edges.
The question is: are you ready to stop guessing and start modeling? If this article sparked your interest, take one small step today. Whether that is opening a Python notebook, reading a book on quantitative finance, or exploring a backtesting platform, momentum matters. Share this article with a fellow trader who is curious about the quant side of markets, and let the conversation begin.

FAQs About Statistical Arbitrage Trading
What is statistical arbitrage trading in simple terms? It is a quantitative strategy that profits from temporary price discrepancies between related financial instruments using statistical models and historical data.
Is statistical arbitrage trading risk-free? No. Despite the word “arbitrage,” it carries real risks including correlation breakdown, leverage amplification, and liquidity risk.
How much capital do you need to start? You can start backtesting with no capital at all. For live trading, it depends on your broker and strategy. Many retail traders begin with $10,000 to $50,000.
Do you need a math degree to do statistical arbitrage trading? Not necessarily. A solid understanding of statistics and programming is more important than formal academic credentials.
What programming language is best for statistical arbitrage trading? Python is the industry standard, with libraries like pandas, statsmodels, and NumPy being the most commonly used tools.
How long do statistical arbitrage positions stay open? It varies widely. Pairs trades can last from a few days to several weeks, depending on the speed of mean reversion in the spread.
What markets can you apply statistical arbitrage trading to? It works across equities, forex, futures, options, and even cryptocurrency markets where correlated instruments exist.
Is statistical arbitrage trading legal? Yes, it is completely legal and widely used by professional hedge funds and proprietary trading firms.
What is the difference between pairs trading and statistical arbitrage trading? Pairs trading is one specific technique within the broader umbrella of statistical arbitrage trading.
Can retail traders compete with hedge funds in statistical arbitrage? Yes, but in different ways. Retail traders can focus on longer time horizons and less liquid markets where high-frequency institutional firms have less advantage.
also read: steamcontroller.co.uk
email: johanharwen@314gmail.com
Author Name: Hamid Ali
About the Author : Hamid Ali is a quantitative finance enthusiast and financial content writer with a deep passion for algorithmic trading strategies, market microstructure, and data-driven investment approaches. With years of experience breaking down complex financial concepts into clear, actionable insights, Hamid helps traders at every level understand the systems and strategies that drive modern markets. When he is not writing, he is exploring new backtesting frameworks and studying the intersection of statistics and financial markets.